Plugin catalog
Official plugins that extend Lightweight Charts™ with new series types, drawing tools, and UX helpers.
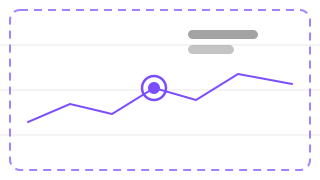
Accessibility
NewDrop-in accessibility layer built on pane primitives: adds semantic markup, keyboard navigation, and screen-reader support to help meet WCAG 2.1 AA.
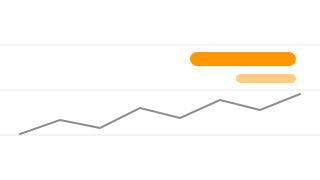
Anchored text
NewText label anchored to an edge, a corner or the center of a pane, on a series or a pane, with configurable margins.
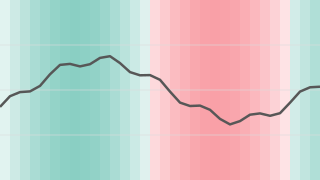
Background shade series
NewSeries that shades the pane behind each bar with a color mixed from its value between a low and a high color.
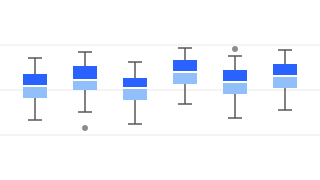
Box and whisker series
NewSeries that draws a box plot per time point: quartile box, median, whiskers and outliers.
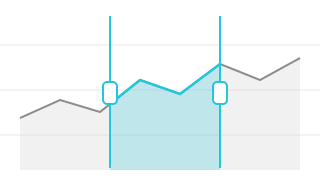
Brushable area series
NewArea series that can style ranges of data differently. Pair it with your own pointer handling to build a brush selection.
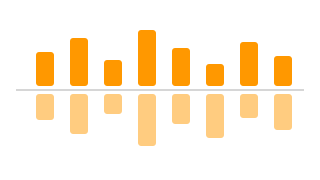
Dual range histogram series
NewHistogram with two nested value ranges above and below a baseline. A compact overlay for buy and sell volumes or net flows.
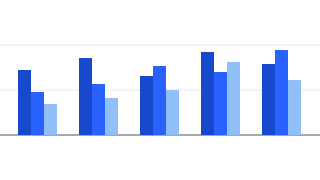
Grouped bars series
NewSeries that draws several values per time point as columns side by side.
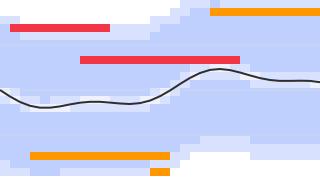
Heatmap series
NewSeries that draws a column of colored price-range cells per time point, such as a volume or order book heatmap.
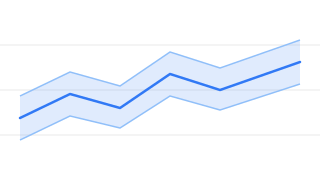
HLC area series
NewHigh-low-close series: fills the band between highs and lows and draws the close as a line on top.
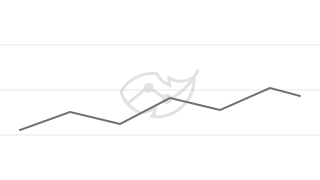
Image watermark
NewImage watermark drawn behind a series or a pane, with position, object fit, size limits, padding, and opacity controls.
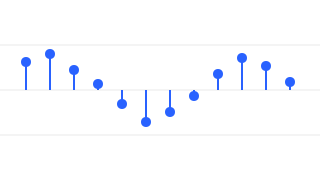
Lollipop series
NewSeries that draws each value as a dot at the end of a stem drawn from a base line.
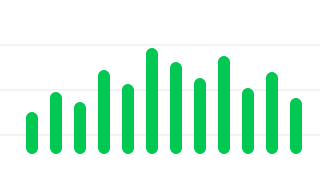
Pretty histogram series
NewHistogram with rounded, evenly spaced columns for a more polished look than the built-in histogram.
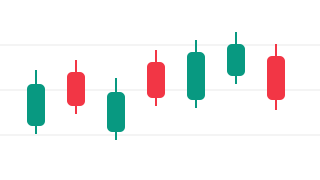
Rounded candles series
NewCandlestick series with rounded corners for a softer visual style. A drop-in replacement for the built-in candlestick series.
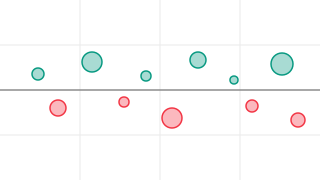
Scatter series
NewScatter and bubble chart: points on a numeric X axis, with groups, data-driven sizes, connecting lines and a hover API.
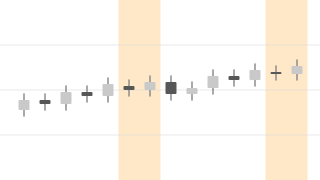
Session highlighting
NewShades the background behind each bar from a color function of its time, for trading sessions, weekends, market hours or any other time-based highlight.

Stacked area series
NewArea series that stacks several values per time point into cumulative bands. Useful for composition-over-time views such as portfolio allocation.
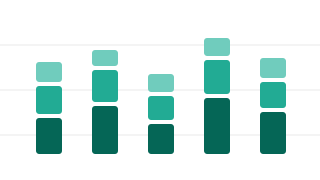
Stacked bars series
NewBar series that draws several values per time point as stacked segments summing to a total.
User price lines
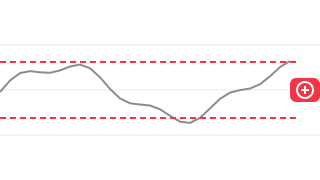
NewLets users add price lines by clicking a + button that follows the pointer at the right edge of the pane, with an API to add, list and remove them.
Vertical line
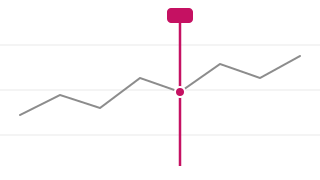
NewFull-height vertical line at a given time, with an optional label on the time axis, for marking events, trades, and session boundaries.